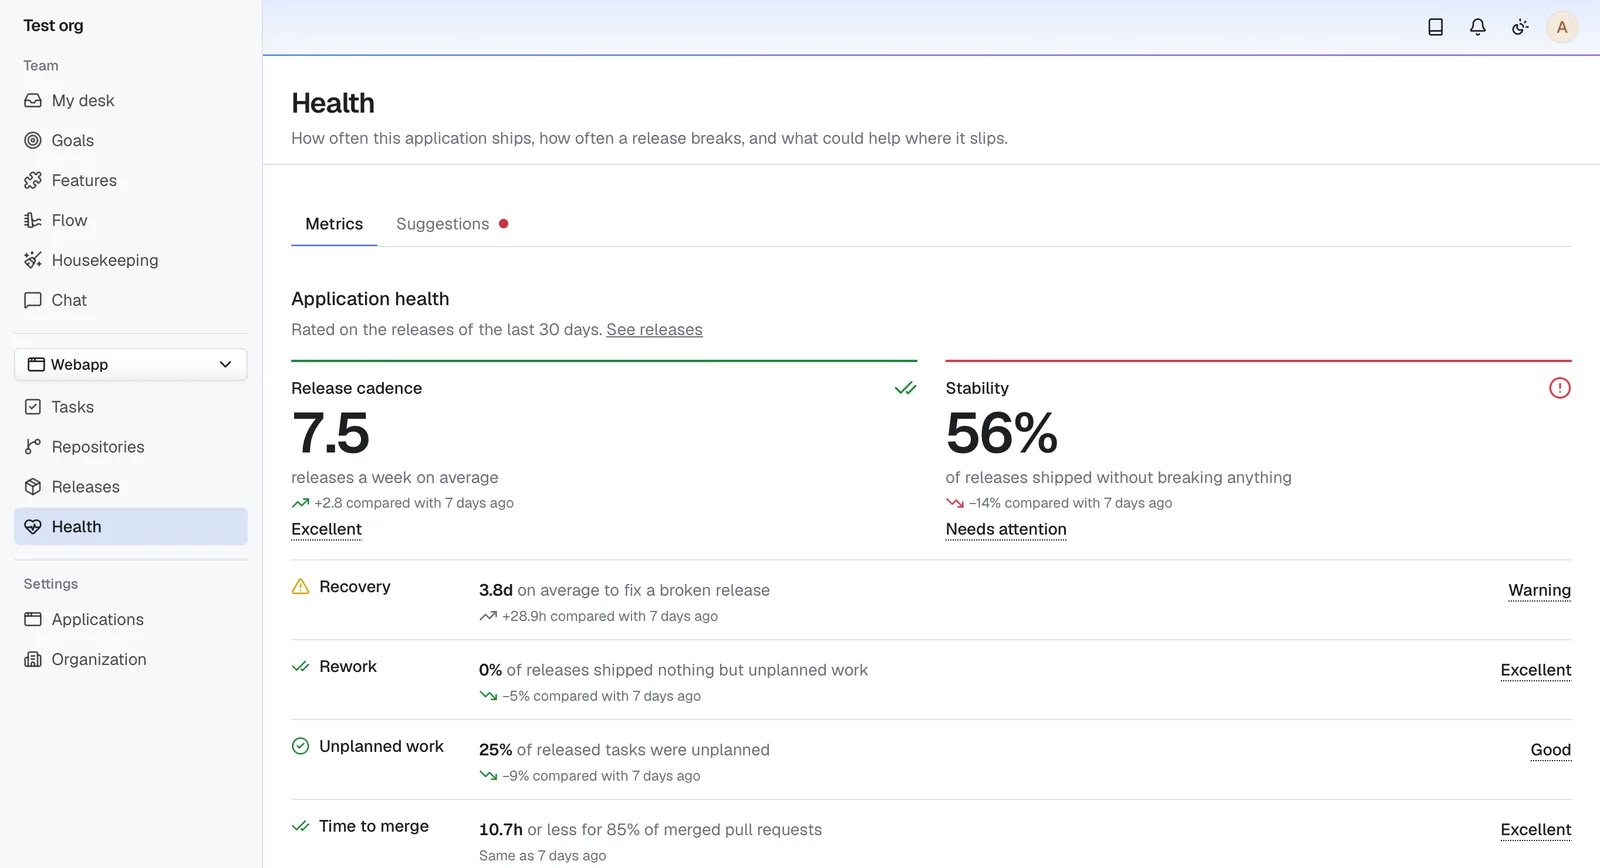
Delivery health
Live DORA metrics
Based on your releases and completed tasks we show you what might improve your delivery. If multiple metrics require attention we recommend you the most likely fix for your root cause
Atlas Principle scores your delivery with DORA metrics. See your weakest metric and what's proven to fix it. Start turning the tide as soon as your next release!
Free 3 month trial, then €399 a year
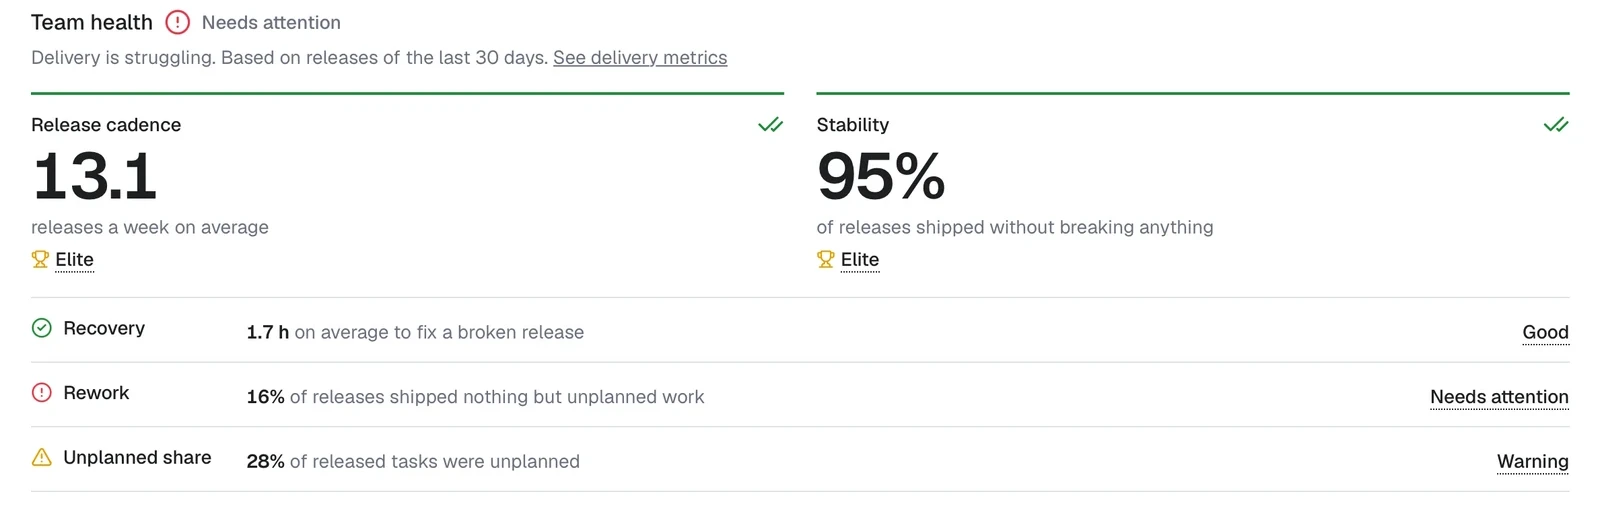
Team health
Manage your tasks and code with Atlas Principle to see where you excel and what could be better
Delivery health
Based on your releases and completed tasks we show you what might improve your delivery. If multiple metrics require attention we recommend you the most likely fix for your root cause
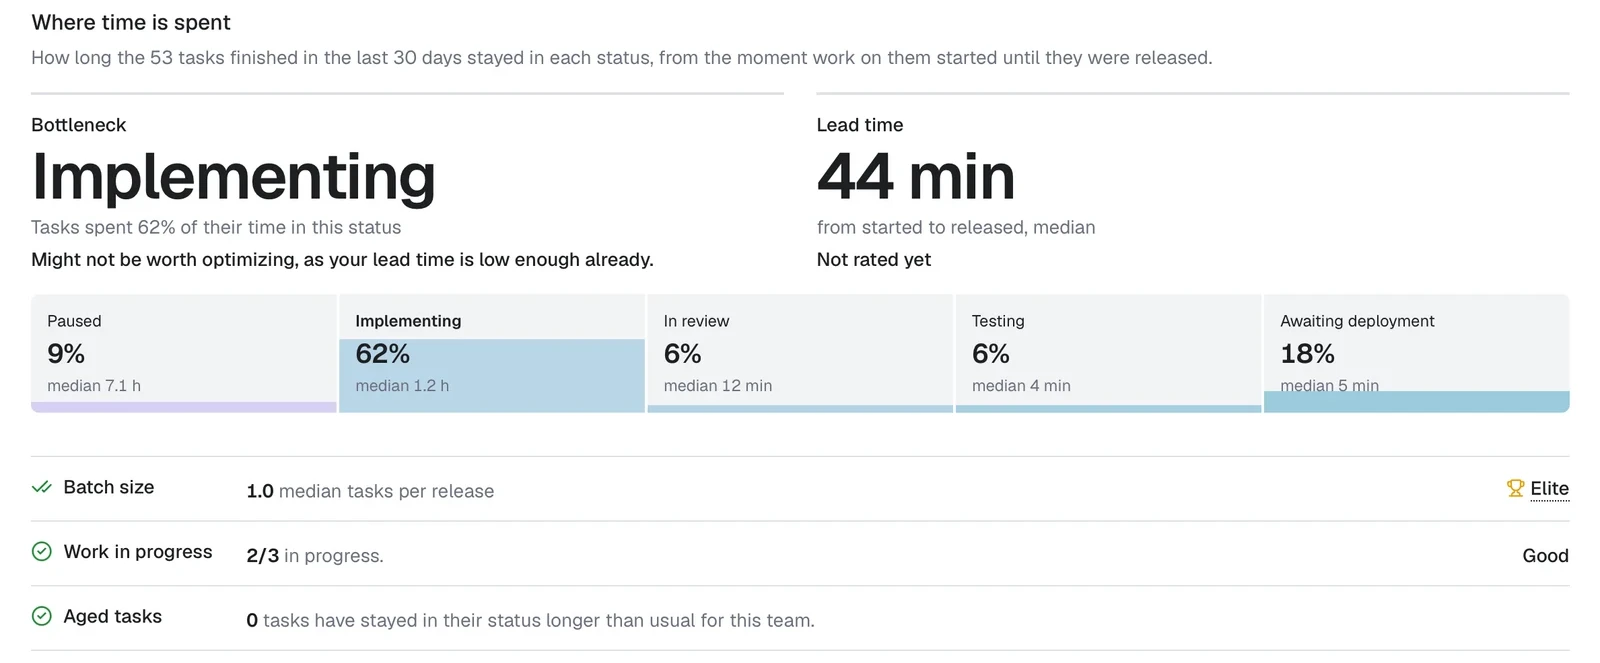
Optimized delivery
Optimizing anything before or after your bottleneck is nothing but wasted time and effort. You'll see where you spend most of your time, whether you're falling behind, or are blocked by parts of your process... and how to improve it
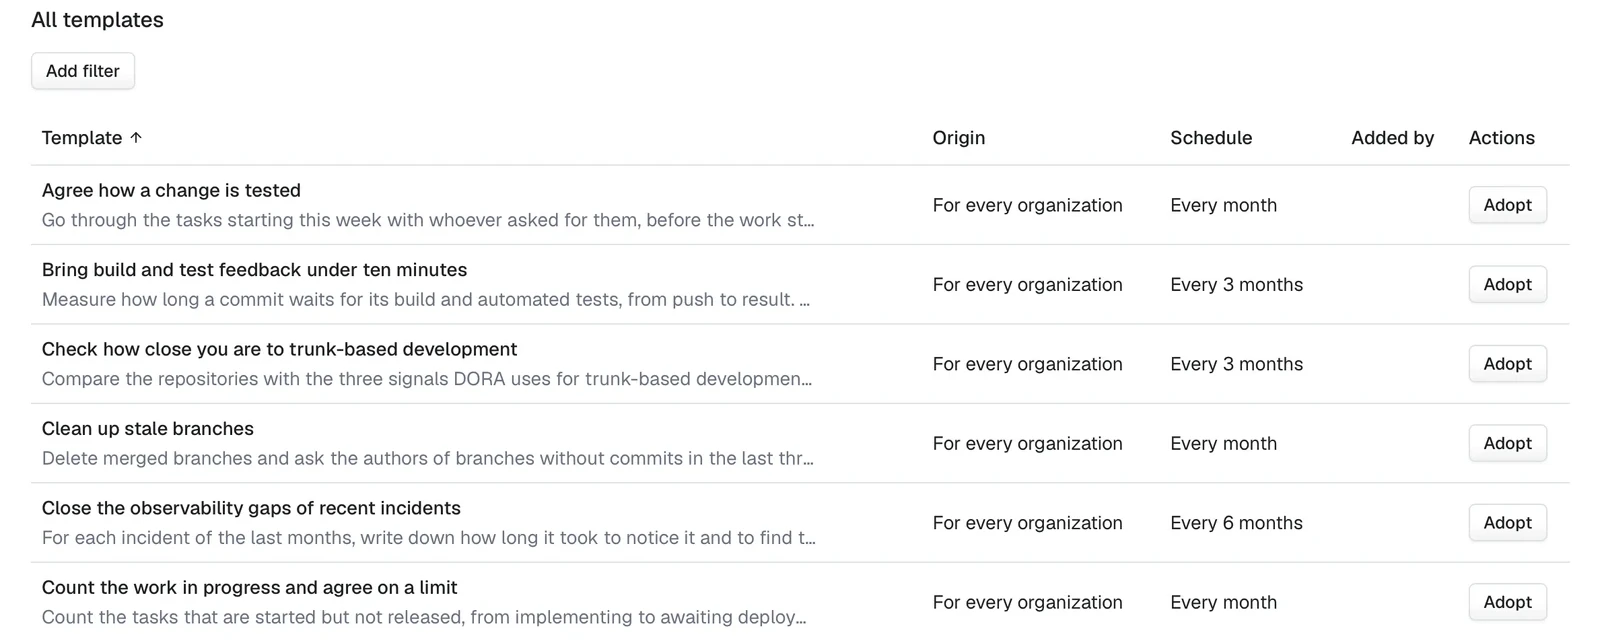
Distilled experience
Best practices brought to you by a decade of research and expertise, scheduled automatically. Makes neglected tech debt more visible, and promotes proactive work to avoid certain problems completely
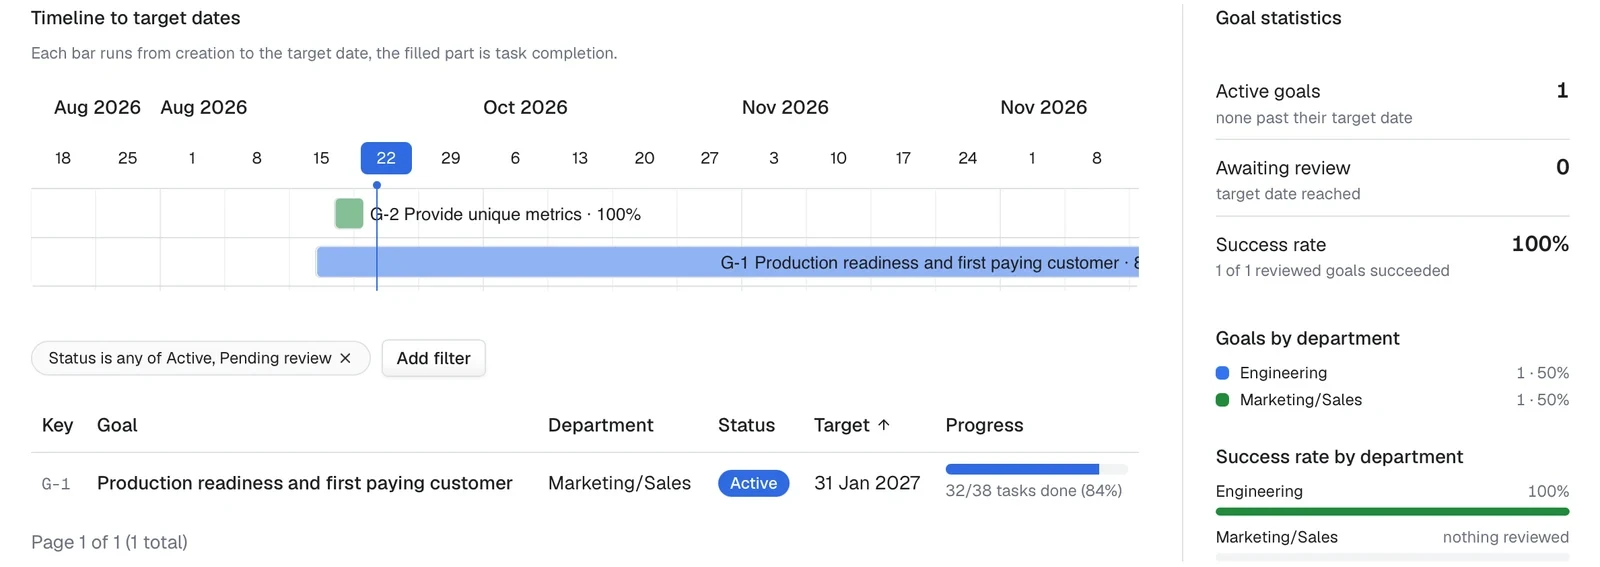
Remember the why
The best performing organizations make every bit of context available for their teams, especially Product & Development. The organization's goals and their expected outcome is always visible, resulting in more accurate and better fitting solutions downstream
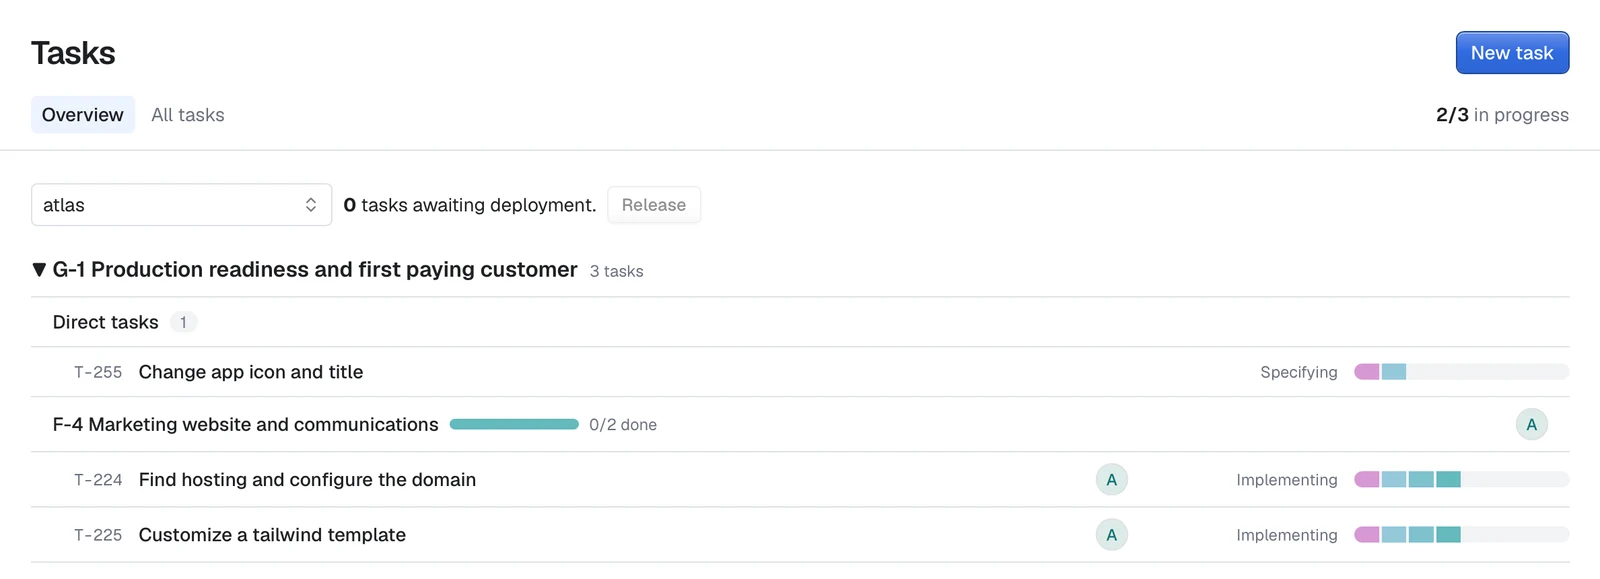
Work more efficiently
An easier to use view of the active work that helps you prioritize completing work that's already started. The way work is sliced makes it easier to see compared to a board where you'd have to scroll in both directions to get the whole picture
Unlimited... within reason
€ 399 per year
Up to 25 people
3 months free trial period
25+ people · Let's talk
OK, this one might be expensive after all
On your own servers · € 999 once
Coming if enough teams ask
To the best of our knowledge, Atlas Principle is the only one that's 100% hosted in the EU, running on 100% renewable infrastructure, and doesn't use AI on your tasks. You also need less software as project management, version control, and metrics are all part of the same package.
Vienna, Austria. Atlas Principle is built there and hosted entirely in the EU, so your data never leaves it.
No, on purpose. Your slowest-looking developer may be the one reviewing everyone else's work. You see how the team ships, which is what customers feel.
Well, why is a board a default for most issue trackers? We believe it was a good idea originally, but over the years people forgot why it was helpful and how to structure processes around it. We present you the same information but in a way that's easier to see and update at once (no scrolling left and right, up and down).
Yes. The numbers show how your team ships, whoever or whatever writes the code.
It measures what they should improve: how often you release, how often releases break and how long work waits. Compare the months before and after a tool and see which way it went.
Yes, if the data says so. Pause a tool and watch what happens. Either way, you walk into the meeting with evidence instead of a hunch.
Use Atlas Principle free for 3 months, then decide if it's worth your time. You'll get actionable results after just a single week!
How often you ship, how often a release breaks and how fast you recover, rated and compared with last week